AI application in the detection of power lines (segmentation-based approach), power poles (object-detection-based approach), and abrupt electrical discharge aka electric-field anomalies or sparks, respectively.
Introduction
Visual inspection of power transmission & distribution networks is often carried out by various Utility companies regularly, to maintain the reliability, availability, and sustainability of electricity supply. Since the inception, the most widely used techniques for inspection are the manual inspection which includes either foot patrol or/and conventional helicopter-based inspection. However, due to the recent widespread application of Drones/Unmanned Aerial Vehicles (UAV), an increase in demand to automate the visual inspection of the infrastructure is observed.
In this article, we have described the two primary approaches required in the detection of two primary types of power distribution infrastructure – Power Lines and Power Poles. Besides, we have also described our approach to detect anomalies in power poles.
Needless to say, before any detailed inspection, the detection of the power infrastructure is mandatorily required. In total, two models were developed, the segmentation model for power lines (cables) and the object detection model for power poles. In addition to these, for anomaly detection on power poles, we have trained our algorithm to detect electrical discharge or sparks. The detailed approaches used for segmentation, object detection, and anomaly detection are described in the following section.
Powerlines Segmentation
The Powerlines Segmentation is used to separate the powerlines (the power transmission cables) from the entire image so that an inspection algorithm can just focus and analyze only the power lines while staying unaffected by the surrounding or the background of the powerlines. In the following section, a technical overview of the Deep Learning method used to create the solution for powerlines segmentation is presented.
- An Overview of the Network Architecture
The Nested U-Net Network used for powerline segmentation is quite similar to the original Convolutional Neural Network (CNN) architecture based conventional U-Net Network. It uses the Dense block of DenseNet Network to improve the overall performance of the U-Net Network. It consists of convolutional layers on skip pathways which bridges the semantic gap between encoder and decoder feature maps, thus aiding in improving the gradient flow. - Datasets
- Dataset 1: We have obtained 200 Visible Light (VL) spectrum images from the https://data.mendeley.com/datasets/twxp8xccsw/1. This dataset is provided for segmentation purposes. It consists of 200 images of size 512×512, along with the binary wired image masks for all the input images.
- Dataset 2: The other set of images was obtained from
https://data.mendeley.com/datasets/n6wrv4ry6v/8. This dataset has a total of 2000 Visible Light (VL) spectrum images of resolution size 128×128.
-
Dataset Preparation
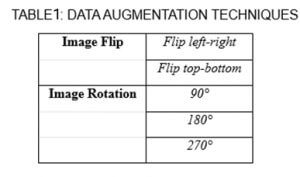
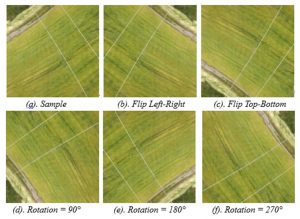
- Dataset 1: This dataset consists of binary masks, so there was no need to generate masks. Unfortunately, this dataset lacks a substantial count of images or samples necessary for training the model. To counter such a problem we used data augmentation techniques such as image flip, image rotation, etc. to generate substantial data synthetically.
- Dataset 2: Images in this dataset are low-quality. Hence, we used image super-resolution to improve image quality further. All the images are super-resolved to 512×512 image size so that we can extract more features (i.e. additional details about power lines) necessary for effective learning. For this dataset, a VGG annotator has been used to annotate images. It gives coordinates of wires in images. Based on these coordinates, the binary ground truths are generated. Further, data augmentations were carried out on Dataset 2 same as Dataset 1.
- Dataset 1: This dataset consists of binary masks, so there was no need to generate masks. Unfortunately, this dataset lacks a substantial count of images or samples necessary for training the model. To counter such a problem we used data augmentation techniques such as image flip, image rotation, etc. to generate substantial data synthetically.
-
Training and Segmentation Methodology
Nested U-Net architecture, as the name implies, makes use of nested and dense skip connections between encoder and decoder apart from the typical skip connection used in U-Net Network. A dense skip connection is used to improve the flow of the gradient. Nested U-Net Network consists of a dense convolution block helpful in collecting the semantic level of the feature map from the encoder part. The Nested U-Net is trained for 200 epochs with a Step size = 20, and the Learning rate = 0.00001. Additionally, Adam optimizer is used. The powerline dataset along with binary masks was prepared. CNN is used for training purposes. Images and its ground truths were inputted to the CNN and predicted masks were obtained from the trained model.-
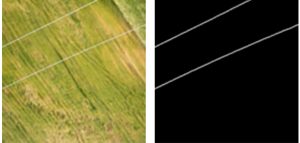
Sample Input Images: Some Sample input images from our dataset are shown here. These contain the power lines which are captured using the UAV mounted cameras.
-
Sample Output Images: The predicted power lines using our model weights are shown here.
-
-
Evaluation Metric
The evaluation metric used in the performance evaluation of the segmentation solution is the Dice Coefficient. The Dice coefficient is very similar to the IoU. Both are positively correlated, meaning if one says model A is better than model B during image segmentation, then the other will say the same. Like the IoU, they both range from 0 to 1, with 1 signifying the greatest similarity between predicted and truth. Dice Coefficient is formulated as,
Electric Poles Detection
A system that can recognize an electric pole in a given image and further runs an analysis over the detected pole would form the basis of the power distribution pole inspection solution. Our currently developed solution uses a “Convolutional Neural Network” architecture to detect power distribution poles in the image. To develop this solution, it requires a set of data consisting of images of poles from various angles. The images are then labelled using a tool that draws a rectangle around the image where the pole is located. These labelled images are resized to a standard size before training the neural network. The neural network trained on these images can successfully detect poles on images kept as testing data, which was a subset of the total labelled dataset.
- An Overview of Network Architecture
We have used YOLOv3, a Darknet detector for power pole detection as it makes predictions with single network evaluations. YOLOv3 is the faster object detection algorithm, an optimal choice for real-time detections without much loss of accuracy. Darknet used here is a variant of Darknet53, which originally has 53 convolutional layers, but we have used 106 convolutional layers in our detector which helps to improve the performance. Another advantage of our system is that it detects better on smaller electrical poles as well. - Dataset
To develops a deep learning model for detecting poles from the street view, we collected the dataset for the same. We gathered the dataset from an open-source Github repository https://github.com/kabrabharat/Electric-Pole-detection-using-darknet/tree/master/dataset. It has 100 images with different image sizes. - Data Preparation Methods
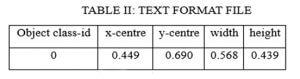
The Data preparation here includes Image resizing. All the images were resized to a size of 432×768. For the training purpose, we need to have an annotated dataset. Image Annotations (ROI) i.e Poles from Images were done using an open-source VGG annotator to get coordinates of bounding boxes xmin, ymin, xmax, and ymax. These are Normalized and converted into the coordinates x, y, w, h which is a format to train YOLOv3. Each image should have a corresponding text file with the same file name as that of the image in the same directory.
The generated text should be in the format:
- Data Augmentation
Unfortunately, this dataset lacks substantial count of images or samples necessary for training the model. To counter such problem we used data augmentation technique such as image flip to generate substantial data synthetically, along with its annotated CSV files. -
Training and Detection Methodology
YOLOv3 is a state-of-the-art, real-time object detection system. It looks at the whole image at the time of test, so its predictions are informed in the global context of the image. It also makes predictions with a single network evaluation which makes it extremely fast vis-à-vis R-CNN and Fast R-CNN. The Darknet, an open-source neural network framework is used to train the detector. For this, we have used electrical poles annotated images and corresponding text files consisting of normalized coordinates of bounding boxes to train the Darknet model. Predicted pole images were obtained using the trained models’ weight file. -
Results of Electric Pole Detection
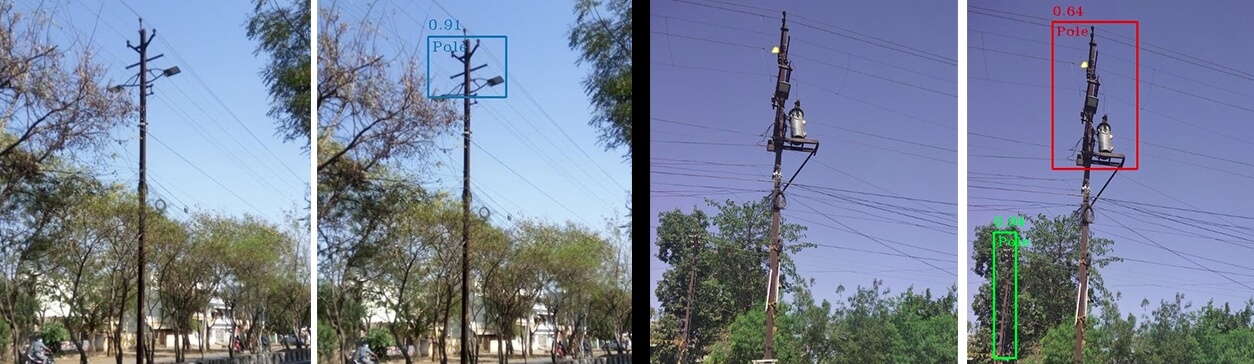
Sample input images, containing electric poles, from our dataset, are presented in images below. Also, the predicted power poles using our model weights are presented in the same.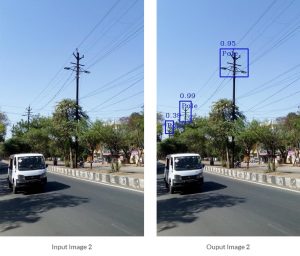
-
Performance Evaluation
We have evaluated the performance of the object detection solution against the entire prepped test dataset. Further, for this whitepaper, we have randomly chosen some images and focused on the confidence of the bounding boxes found by our model. Following are the results, vis-à-vis the confidence of the bounding boxes.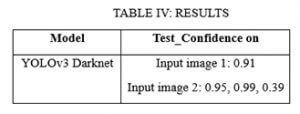
Anomaly Detection: Abrupt Electrical Discharge or Sparks on Power Poles
The utility poles of electric power distribution lines are very vulnerable to many natural hazards, while power outages due to pole failures can lead to adverse economic and social consequences. Utility companies, therefore, need to monitor the conditions of poles regularly and predict their future conditions accurately and promptly to operate the distribution system continuously and safely. Our system presents a novel pole monitoring method that uses computer vision methods to meet the need. It processes the input image which is captured by any angle, detects the power pole at any distance and at lastly classifies those poles into two classes: Sparking near Pole, No sparking.
- Training and Spark Detection Methodology
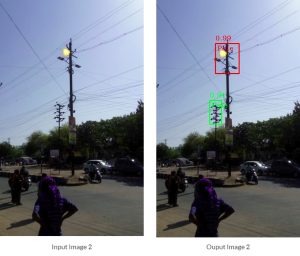
The Power Poles were detected using pole detection algorithms. Those detected poles are cropped and passed as input to the spark detection system. For spark detection, our system architecture uses Computer Vision approaches for noise removal, binarization and detection of regions of interest. Further, we go for the image binarization to get the ROI based on intensity values. As we get ROI we use noise removal techniques again to reduce the noise. As we find out the spark in between the wires and pole, our system marks it as an anomaly. - Results of Spark Detection
In the following figures, it can be seen that the Red Bounding Box around the Pole indicates there is sparking near to the pole and Green box indicates no sparking.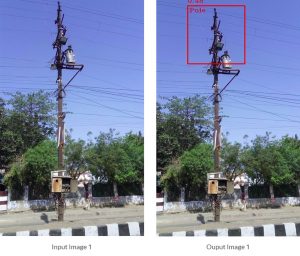
Conclusion and Future Work
The electrical power lines, poles, and electrical discharge detection presents a starting point for the development of the completely automated inspection solution. The ability to do more targeted inspections in the future will allow Utility companies to go out and conduct maintenance efficiently as well as in a more targeted fashion. Currently, we are engaged in further improving in-house developed neural network models. Also, in parallel, we are working on expanding Utility solutions by adding more electrical discharge anomaly solutions. Our goal is to build an AI governed Utility suite which can be used by the Utility companies in order to inspect their assets. In short, with the main focus on safeguarding the world’s energy infrastructure, the following are the prime objectives we are working and tend to include in upcoming days:
- Inclusion of different types of anomaly detection such as broken power lines, bent electrical poles, multiple objects hanging on the overhead power lines etc.
- Improving the detection performance further by experimenting with various algorithms for object detection and segmentation.
- Improving performance by collecting more diversified training data.
- Improving/Optimizing the algorithm and making it more robust by adding more diversified data.
- Experimenting in miniaturizing these algorithmic models so that they can be ported easily onto the laptops, and there will be no dependency on high-performance servers.